Difference between revisions of "Ultrasonic Distance Sensor"
(Tag: Visual edit) |
|||
| (3 intermediate revisions by the same user not shown) | |||
| Line 1: | Line 1: | ||
| + | [[File:maxsonar ez1 ultrasonic sensor.jpg|thumb|200x200px|Maxsonar Ultrasonic Distance Sensor]] | ||
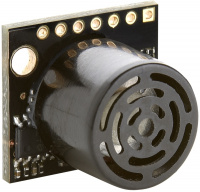
Ultrasonic range sensors measure the distance to an object by bouncing ultrasonic waves off of it. Since the wave's speed of travel is known, the elapsed time between when the wave is emitted and when it returns to the sensor can be used to calculate the distance to the object. These sensors come in varying ranges and strengths but can be fairly accurate at a relatively inexpensive price. | Ultrasonic range sensors measure the distance to an object by bouncing ultrasonic waves off of it. Since the wave's speed of travel is known, the elapsed time between when the wave is emitted and when it returns to the sensor can be used to calculate the distance to the object. These sensors come in varying ranges and strengths but can be fairly accurate at a relatively inexpensive price. | ||
| − | == Sensor Overview == | + | |
| + | |||
| + | |||
| + | |||
| + | <br /> | ||
| + | |||
| + | <br /> | ||
| + | |||
| + | ==Sensor Overview== | ||
'''Obstacle Detection:''' Detects the nearest obstacle in a cone. Although the detection area is significantly larger than IR and 1D lidar, the ultrasonic sensor still only measures the distance to the closest object. Maximum detection range is about 15 feet. | '''Obstacle Detection:''' Detects the nearest obstacle in a cone. Although the detection area is significantly larger than IR and 1D lidar, the ultrasonic sensor still only measures the distance to the closest object. Maximum detection range is about 15 feet. | ||
| Line 7: | Line 16: | ||
'''Sensor Pros:''' | '''Sensor Pros:''' | ||
| + | |||
*Data is easily processed, allowing the use of cheaper microcontrollers | *Data is easily processed, allowing the use of cheaper microcontrollers | ||
*Inexpensive | *Inexpensive | ||
| Line 12: | Line 22: | ||
'''Sensor Cons:''' | '''Sensor Cons:''' | ||
| + | |||
*Ultrasonic emissions can echo, causing the receiver to pick up “ghost” data | *Ultrasonic emissions can echo, causing the receiver to pick up “ghost” data | ||
*Similarly, complications can arise if multiple ultrasonic sensors are used since receivers can pick up emissions from other sensors. Some effort may be required to coordinate the emit/receive measurement times for each sensor. | *Similarly, complications can arise if multiple ultrasonic sensors are used since receivers can pick up emissions from other sensors. Some effort may be required to coordinate the emit/receive measurement times for each sensor. | ||
| − | == Ultrasonic Beam Detection Patterns == | + | ==Ultrasonic Beam Detection Patterns== |
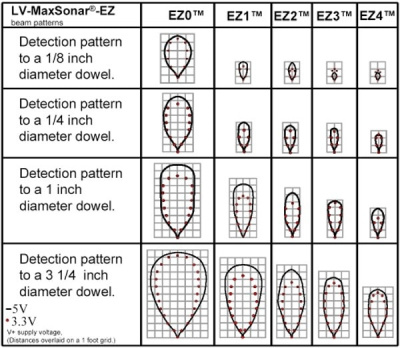
Here is a comparison of beam detection patterns between sensors in the LV-MaxSonar-EZ line: | Here is a comparison of beam detection patterns between sensors in the LV-MaxSonar-EZ line: | ||
| − | + | [[File:maxsonar beam patterns.jpg|center|thumb|400x400px|Maxsonar Sensor Beam Patterns Comparison]] | |
| − | + | The beam patterns are shown as viewed from the top, though they would look si'''m'''ilar viewed from the side as well. The patterns are generated by keeping the sensor at a fixed location (the bottom center of each grid, facing up) and a dowel is moved in at progressively further distances from the sensor until the dowel is detected. By tracking the points where the dowel is detected and lost by the sensor, the beam pattern profile is generated. | |
| − | |||
| − | The beam patterns are shown as viewed from the top, though they would look | ||
Each column is a different ultrasonic sensor model, and a different diameter test dowel is used for each row of the table. Note that the sensors are all able to detect larger dowels from further distances away and thus have larger beam detection patterns on the lower rows of the table. Conversely, they can only see smaller dowels at close distances and have smaller detection patterns on the upper table rows where smaller dowels are used. The solid black line shows the beam pattern when the sensor is powered at 5V, while the red circles show the beam pattern while the sensor is powered by 3.3V. For these sensors, the beam detection pattern is almost always larger with 5V than with 3.3V. | Each column is a different ultrasonic sensor model, and a different diameter test dowel is used for each row of the table. Note that the sensors are all able to detect larger dowels from further distances away and thus have larger beam detection patterns on the lower rows of the table. Conversely, they can only see smaller dowels at close distances and have smaller detection patterns on the upper table rows where smaller dowels are used. The solid black line shows the beam pattern when the sensor is powered at 5V, while the red circles show the beam pattern while the sensor is powered by 3.3V. For these sensors, the beam detection pattern is almost always larger with 5V than with 3.3V. | ||
| Line 26: | Line 35: | ||
Depending on the application, a wide or narrow beam wave might be a better fit. The HRLV-MaxSonar-EZ0 has the widest and most sensitive beam pattern of any unit from HRLV-MaxSonar-EZ sensor line. This makes the HRLV-MaxSonar-EZ0 an excellent choice for use where high sensitivity, wide beam, or people detection is desired. The HRLV-MaxSonar-EZ4 is the narrowest beam width sensor that is also the least sensitive to side objects offered in the HRLV-MaxSonar-EZ sensor line. The HRLV-MaxSonar-EZ4 is an excellent choice when only larger objects need to be detected. | Depending on the application, a wide or narrow beam wave might be a better fit. The HRLV-MaxSonar-EZ0 has the widest and most sensitive beam pattern of any unit from HRLV-MaxSonar-EZ sensor line. This makes the HRLV-MaxSonar-EZ0 an excellent choice for use where high sensitivity, wide beam, or people detection is desired. The HRLV-MaxSonar-EZ4 is the narrowest beam width sensor that is also the least sensitive to side objects offered in the HRLV-MaxSonar-EZ sensor line. The HRLV-MaxSonar-EZ4 is an excellent choice when only larger objects need to be detected. | ||
| − | == Products == | + | ==Products== |
[https://www.superdroidrobots.com/shop/category.aspx/sonar-range-finders/107/ Sonar Range Finders] | [https://www.superdroidrobots.com/shop/category.aspx/sonar-range-finders/107/ Sonar Range Finders] | ||
[[Category:Sensors]] | [[Category:Sensors]] | ||
Latest revision as of 15:40, 3 March 2021
Ultrasonic range sensors measure the distance to an object by bouncing ultrasonic waves off of it. Since the wave's speed of travel is known, the elapsed time between when the wave is emitted and when it returns to the sensor can be used to calculate the distance to the object. These sensors come in varying ranges and strengths but can be fairly accurate at a relatively inexpensive price.
Sensor Overview
Obstacle Detection: Detects the nearest obstacle in a cone. Although the detection area is significantly larger than IR and 1D lidar, the ultrasonic sensor still only measures the distance to the closest object. Maximum detection range is about 15 feet.
Ideal operating conditions: No sources of external ultrasonic noise present.
Sensor Pros:
- Data is easily processed, allowing the use of cheaper microcontrollers
- Inexpensive
- Good detection range and update rate
Sensor Cons:
- Ultrasonic emissions can echo, causing the receiver to pick up “ghost” data
- Similarly, complications can arise if multiple ultrasonic sensors are used since receivers can pick up emissions from other sensors. Some effort may be required to coordinate the emit/receive measurement times for each sensor.
Ultrasonic Beam Detection Patterns
Here is a comparison of beam detection patterns between sensors in the LV-MaxSonar-EZ line:
The beam patterns are shown as viewed from the top, though they would look similar viewed from the side as well. The patterns are generated by keeping the sensor at a fixed location (the bottom center of each grid, facing up) and a dowel is moved in at progressively further distances from the sensor until the dowel is detected. By tracking the points where the dowel is detected and lost by the sensor, the beam pattern profile is generated.
Each column is a different ultrasonic sensor model, and a different diameter test dowel is used for each row of the table. Note that the sensors are all able to detect larger dowels from further distances away and thus have larger beam detection patterns on the lower rows of the table. Conversely, they can only see smaller dowels at close distances and have smaller detection patterns on the upper table rows where smaller dowels are used. The solid black line shows the beam pattern when the sensor is powered at 5V, while the red circles show the beam pattern while the sensor is powered by 3.3V. For these sensors, the beam detection pattern is almost always larger with 5V than with 3.3V.
Depending on the application, a wide or narrow beam wave might be a better fit. The HRLV-MaxSonar-EZ0 has the widest and most sensitive beam pattern of any unit from HRLV-MaxSonar-EZ sensor line. This makes the HRLV-MaxSonar-EZ0 an excellent choice for use where high sensitivity, wide beam, or people detection is desired. The HRLV-MaxSonar-EZ4 is the narrowest beam width sensor that is also the least sensitive to side objects offered in the HRLV-MaxSonar-EZ sensor line. The HRLV-MaxSonar-EZ4 is an excellent choice when only larger objects need to be detected.

